
What usage rate means for NBA player props (and how to read it with minutes)

Usage rate estimates the share of team plays a player uses with a shot attempt, free throws or a turnover while on the court. It measures involvement, not shooting skill. For points props, read it alongside minutes and efficiency: a bigger share doesn't help much if the player spends less time on the floor.
Start with the exact line on Bet Check, then ask whether the player's expected role supports it.
What usage rate measures
The NBA defines usage percentage as the percentage of team plays used by a player when he's on the floor. Shots, possession-ending free throws and turnovers count. Assists don't.
The familiar Basketball-Reference formula estimates that share from shot attempts, free-throw attempts and turnovers, adjusted for minutes and team totals. It weights free-throw attempts by 0.44 because one attempt isn't necessarily a separate play.
Calling usage "possessions ended" is shorthand: a missed shot can lead to an offensive rebound and continued possession. Usage also isn't time spent holding the ball.
With five players sharing the work, 20% is an equal-share reference point. It isn't a measured league-average benchmark for every published formula, or a quality rating. A player can use plenty of plays and shoot badly.
Why minutes come first
Think minutes, usage and efficiency for points, but don't multiply those numbers and call the result a scoring projection. Pace, the number of possessions played, matters too. Turnovers consume usage without producing points.
Here's an illustration, not player data. At the same team pace, compare 30% usage over 24 minutes with 25% over 36 minutes. Multiplying share by minutes gives 7.2 versus 9.0. The lower-usage player has 25% more estimated used plays despite the smaller share.
That doesn't guarantee more points. It shows why checking a minutes restriction can matter more than admiring a high usage number. Verify likely playing time before treating a season-long role as tonight's workload.
Which props usage helps explain
Points have the clearest connection to scoring involvement, but inspect the attempts behind the number. More turnovers can raise usage without adding shots.
For threes, check three-point attempts specifically. Extra usage could come from drives and free throws instead. Usage alone doesn't establish a larger three-point role.
Assists depend on creating opportunities that teammates finish. A returning scorer could help a passer's assists while reducing his own shooting share. Rebounds depend on available misses, positioning and minutes; usage doesn't directly count them.
Combination props such as points plus rebounds plus assists include a scoring component, but don't assume each component changes together. Research the stat you're actually betting.
When a teammate sits
The replacement in the starting lineup isn't automatically the player getting more shots. One teammate may gain minutes while another takes over ballhandling. Losing a creator can also make the remaining shots harder.
Look for comparable lineups, not just the missing player's scoring average. The teammate-out research guide covers injury news and small samples. Recheck today's line and price: a role change can already be reflected in both.
Blowouts, foul trouble and back-to-backs
A starter can keep his usual share during his minutes and still finish below a points line because he sits late. A large spread raises a game-script question; it doesn't tell you exactly how many minutes he'll lose.
Foul trouble can interrupt a rotation. Back-to-backs can bring rest or workload changes, but don't assume an automatic reduction. Check current reports and coaching comments. The rest and schedule guide explains the wider context.
A free cross-check: his share of the team's points
WagerLens's public player table doesn't show usage, minutes or shot attempts. It does show points. Divide those by the team's points from the same game to check scoring share.
This is scoring output, not a substitute for usage. It leaves out missed shots, free-throw attempts and turnovers. It also compares full-game totals rather than only the minutes he played.
The cover shows Tatum's last-five-games table, captured November 11, 2026. Open the screenshot full size. These are the figures shown by WagerLens, not an independently audited box-score dataset.
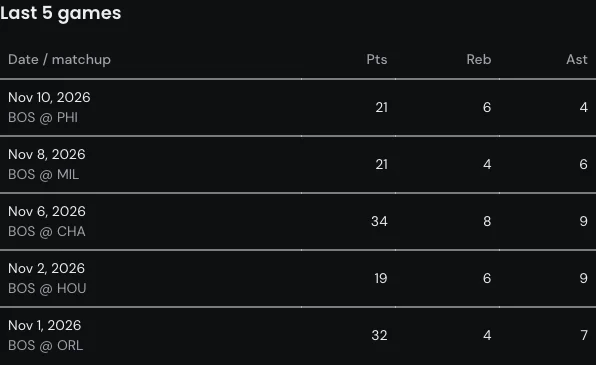
| Game, 2026 | Tatum | Boston | Share |
|---|---|---|---|
| Nov 1, ORL | 32 | 108 | 30% |
| Nov 2, HOU | 19 | 93 | 20% |
| Nov 6, CHA | 34 | 119 | 29% |
| Nov 8, MIL | 21 | 117 | 18% |
| Nov 10, PHI | 21 | 123 | 17% |
Games are away at Orlando (ORL), Houston (HOU), Charlotte (CHA), Milwaukee (MIL) and Philadelphia (PHI).
Shares are rounded: 21 divided by 123 is about 17%. Boston totals come from its team-total check. Its game-log dates appear one day earlier than the player page; this table uses player-page dates and matches opponents.
Boston scored 117 and 123 in the final two listed games, while Tatum scored 21 in each. His scoring share was smaller than in the Orlando game.
For Philadelphia, WagerLens records Tatum over 26.5 points as a miss with 21, and Boston over 108.5 team points as a hit with 123. Team scoring didn't ensure his individual over.
These five games don't explain why his share changed. Check minutes and attempts elsewhere before attributing it to a new role.
Season usage versus the last two weeks
Season usage provides a longer baseline. Recent usage can reveal a different role, but a short window can also reflect unusual lineups or opponents.
If a teammate is out long term or a player becomes a starter, compare games under that arrangement. Otherwise, investigate the swing rather than assuming it will continue. The hit-rate guide explains why small samples need context.
How to use this on a WagerLens check
Open a current NBA points check and confirm the player, side and exact line. Read hits and total games together; compare available last-three, last-five and last-ten windows and the recent average.
Use scoring share to identify a question, then verify minutes, attempts and injury news separately. Compare the current sportsbook quotes and their timestamps. Current price comparison is free; Premium adds per-book price history and line movement. Confirm the offer at the book.
Check a prop free. If you want to revisit the research, choose "Save this check"; a free account is required. Saving research doesn't require placing a bet.
FAQ
What is usage rate in basketball?
Usage rate estimates the percentage of team plays a player uses through shot attempts, free throws and turnovers while on the court. It doesn't count assists or simply holding the ball. A 20% share is the equal-share reference for five players, not a threshold that separates good players from bad ones.
How does usage rate affect NBA player props?
Usage helps explain scoring opportunities, but points still depend on minutes, pace and efficiency. Extra usage could mean more two-point attempts, free throws or turnovers rather than more threes. Check what changed in the player's workload, then compare the exact line and price. Higher usage alone doesn't establish a worthwhile bet.
Why do minutes matter as much as usage?
Usage describes a share while the player is on the floor, not his workload over the whole game. A player with a large share but limited minutes can get fewer opportunities than a lower-usage starter. Minutes restrictions, foul trouble and rotation changes can therefore undermine a points argument built on usage alone.
Do rebounds and assists props rise with usage the same way points do?
No. Assists require teammates to finish shots, and assists aren't counted in the usage formula. Rebounds depend on available misses, positioning and playing time. A role change can affect all three markets, but a usage increase doesn't tell you how many assists or rebounds to add to a projection.
What happens to usage when a teammate is out?
The remaining lineup must handle the offense, but the missing player's work doesn't transfer intact to one replacement. Several teammates may gain shots or ballhandling responsibilities, and the offense may become less efficient. Check comparable lineups and current news, then reassess the line and price after any market adjustment.
Should I trust season usage or the last five games more?
Use the season as context and recent games to investigate a specific role change. A new starter or extended teammate absence can make older games less comparable. Five games still leave uncertainty, especially with unusual opponents or minutes. Without an identifiable change, don't treat a short swing as proof of a new role.
Research, not picks. Past results aren't a forecast. Passing is a valid decision.
21+ | 1-800-GAMBLER
See it live before you bet
NBA props with best prices, hit rates with sample sizes, and a public track record.
- Every pick graded — wins and losses, no filters
- Hit rates for the exact line and recent windows
- Sportsbook price comparison on free Bet Checks
- Premium adds tracking, history and stats, and alerts
- Public track record with wins and losses